Showing posts with label medium term nifty. Show all posts

Tuesday, 26 June 2012

Nifty & USD/INR Report- 26th June, 2012

Daily Nifty Analysis

xDirect India's Nifty Analysis_26.06.2012
Benchmark indices ended weak erasing early gains, as investors were not impressed by the RBI’s measures to stem the rupee’s fall and the government did not announce any reforms as pledged last week. RBI enhanced the FII limit in G-Secs to $20 billion from $15 billion. It also allowed Indian companies in infrastructure to borrow through the ECB route up to $10 bn. The low amount of liquidity would obviously take away volatility and volumes which eventually turned out to be a negative session for the Nifty. Even the global markets were quite sticky with risk aversion combined with overselling kept the price movements range bound with the US Dollar just bouncing on every dips.

With the sudden drop in the market being witnessed yesterday, the government has announced today that it would take necessary steps to stem the Rupee depreciation; nevertheless these comments came in futile as global uncertainty has indeed gripped on the bull traders to resume on their trading with INR still hovering at its all-time low levels. For today we have a light on the counter from Euro Zone and UK, but US Consumer Confidence being the most important. However the Indian markets would trade sideways with supports coming in at interim levels of 5095 levels (Rising trend line). Followed by 5050 (50% retracement) and then 5023 (Falling trend line). Resistance is seen towards 5140, 5178 levels; however considering bearish trend has been commenced we believe Nifty has little chance of building momentum over 5180 levels for the week.

View on Indian Rupee
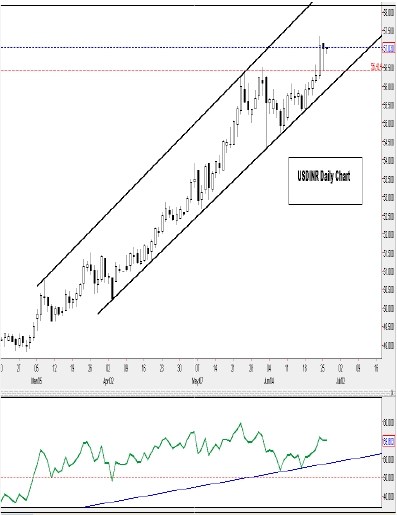
xDirect India's USD/INR Analysis_26.06.2012
The Indian Rupee gained sharply in yesterday’s trade bolstered by the expectations of big-bang policy measures from the Government of India and the RBI. The Rupee opened sharply higher and continued rising to make a high near the 56.3750 level. Though it weakened from day’s high and ended at 57.01 to the US Dollar after the measures  introduced by the RBI disappointed markets.

The main step announced was to increase in the cap on foreign investment in Indian government debt  to  $20  billion  from  $15  billion.  The government also reduced the minimum period investors need to hold some bonds to three years from five years, making them more attractive to foreign funds.

The Indian Rupee is expected to trade in a tight spot where in, where on the upside the resistance is seen towards 57.42 (Fibonacci extension) followed by 57.65 levels. Supports come in at 56.40 (yesterday session low). There might be some sort of positives seen in the market considering the constant selling but we believe the bear trend would resume considering the ill-liquid FOMC state,, followed by the multiple downgrades. For today however we would want the US Consumer Confidence to give some amount of boost as yesterday’s housing sales marked good numbers, its best in 3 years.


For today the market is expected to be range bound however, where European session may mark some amount of swings in the global market which may give certain movement in the currency pair.

Report By
xDirect India
www.xdirect.in


Wednesday, 6 June 2012

Nifty & USD/INR Report – 7th June, 2012

Daily Nifty Analysis

 India’s benchmark indices rose 2.7% on Wed, posting their biggest daily percentage gain since early January 2012 that was boosted by hopes of a rate cut by the RBI. Expectations that the ECB will announce more stimulus measures to resolve Euro Zone’s financial problems also contributed to the gains in global markets.

Market has moved upp in the expectation of policy actions both at India and International levels. We anticipate market may test resistance at around 5050-5075 and will need actual policy actions from various governments to cross this level.
Market  sentiments  were  positive on  the announcement from the European Central Bank issuing a schedule for an additional long term refinancing operation (LTRO) as insurance against further flight of banks accounts in Europe. Rising hope of policy rate cut by RBI, expected positive outcome from upcoming realty and construction sector also moved on the back of cuts in rates from the RBI.
Nifty has breached the resistance of 4965 levels, where decisively it portrays a bullish pattern. Only a further trigger should bee provided from various governments in order for a clean upside rally in the equity markets. Index is likely to cross 5,000 mark to test levels at 5,060 followed by 5,120 levels. As positions on net buyers have increased the support of 4960 should be labeled as an opportunity to go long, a break of which 4938 should be held as intraday support. Nevertheless the breach of the same should negate the bullish sentiments across the market.


View On Indian Rupee


USD/INR_07.06.2012_xDirect India
The Indian Rupee advanced for the third straight session against the Greenback led by improving risk appetite amidst increasing hopes of stimulus from larger economies. Gains in the domestic stock markets too aided the strength in the local currency which has been able to stay well above the record low of 56.52 hit on last Thursday.

Yesterday, the partially convertible Rupee ended at 55.36 to the USD after trading in a range between 55.61 on the upside to 55.15 on the downside and ended the day at 55.35.
The Indian Rupee is expected to trade positively today, tracking the strong gains in the Asian stocks and the uptick in the Euro which pushing the Dollar index lower. Nevertheless a rate cut from RBI should actually pave for depreciation in Indian Rupee; however as equity markets rally’s across the board the depreciation would be negated by boosting the strength in the Indian Rupee.

As London session begins we expect a further upside in the Indian rupee, where the USDINR would be poised to test the lower end of the bull trend channel at 54.80 levels and only a breach and close below it should provide leeway for 54.35 levels (horizontal line support coupled with June1st low). On the resistance front, yesterday’s high of 55.61 should negate the downside in the pair and should be considered as intraday upper resistance.


Report By

xDirect India

www.xdirect.in


Friday, 23 March 2012

Nifty & USD/INR Report- 23rd March, 2012


View On Nifty 


Nifty: Nifty yesterday after the Negative opening at 5374 failed to trade above 5410 and reverted where on higher side it tested the level of 5406 and closing was seen at 5223 at the days Low. Asia markets fell Friday amid renewed concerns about global growth, with losses for banks and property firms pushing Hong Kong into the red, while a stronger yen weighed on Japanese exporters. Global markets switched to a risk-off stance this week, led by disappointing global manufacturing numbers. The euro area [data] suggests the economy is still in the woods, as France and Germany look vulnerable to slowdowns. Today as the Asian market are flat and nifty is expected to open sideway and trading range for the day will be 5270 resistance and support of5190 level. On higher side it may test the level of 5250 to 5270 and then after reversal in price may be seen and crossover below 5190 will bring back to 5150 - 5120 level lower side, whereas on higher side resistance is seen at 5295. Stochastic which are trading in the mid zone has give negative intersection and is still nearing 30% where its side way to downside moving and some correction is still expected in near term with yesterday move.

View On USD/INR:                                                            


USD/INR:    Rupee in last trading session closing was seen at 50.63 where price are trading in the upside moving range in the past few trading session, where the lower side support is seen at 50.4 and resistance of 51 was holding. Today opening is seen at the level of 50.66 where news from Europe, Greece is close to restructuring its debts with private creditors, and although such an agreement will serve as a welcome sigh of relief, much remains to be done to get the bulk of Europe growing again. In short term trading range will be 50.8 supports and 51.5 resistances and will remain side way to upside move in coming days. Stochastic are trading side way which has given positive intersection in lower zone which indicates price will move side way to positive and will in the trading range for some time.

Report By:
xDirect India

Tuesday, 22 November 2011

Nifty Medium Term Outlook- 23rd november, 2011

View On Nifty:

Support: 4400 – 4585 - 4660 Pivot: 4777 Resistance: 4850 - 4965 - 5160


Nifty: The head-and-shoulders pattern is one of the most popular and reliable chart patterns in technical analysis. And as one might imagine from the name, the pattern looks like a head with two shoulders. Head and shoulders is a reversal pattern that, when formed, signals the security is likely to move against the previous trend. There are two versions of the head-and-shoulders pattern. The head-and-shoulders top is a signal that a security's price is set to fall, once the pattern is complete, and is usually formed at the peak of an upward trend. The second version, the head-and-shoulders bottom (also known as inverse head and shoulders), signals that a security's price is set to rise and usually forms during a downward trend. Looking at the chart of Nifty it has started its rally from 2525 and after testing the higher level of 5300 short correction was seen forming the left shoulder and tested the support of 4700 level. There after the rise which was seen crossed the higher level of 5300 and move further upside where 6330 were tested. There after reversal for the higher level again it has taken support at 4730 level and formed a neck line where shot bounce which was expected has been seen and tested the higher level of 5400 level. Further we are looking the formation of the Right Shoulder where short term top is expected to be posted and will move to test the Neck Line which comes at 4730 level and once this support of 4730 and sustain trading below 4700 will confirm the down trend where its next down side target will be the previous bottom of 2600 around. If we look at the Fibonacci Expansion of point a-b from point c which comes to 3700 which is 161.8% and 2660 comes to 261.8% level will be the immediate target where it may get halt for some time before the next round of selling which may be seen after short bounce. We are on the over view where the lower side bottom may be seen at 2600 with + - of 200 points. Stochastic are trading in mid zone and is moving towards the lower level and is expected to sustain in oversold zone where further fall in price may be expected.

Report By:-
xDirect India

Blog Archive